dHEDGE Now Has Built-In TradingView Charts
You can now track vault performance directly on dHEDGE using built-in TradingView charts.
No TradingView account needed. No external tabs. The charts are right there on the vault page.
Open the Chart
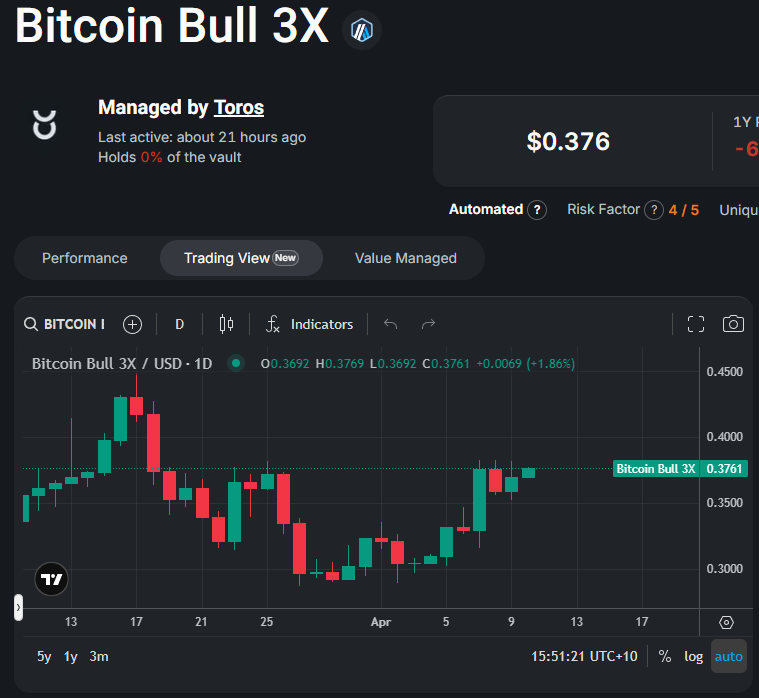
When you visit any vault page on dHEDGE, click the Trading View tab to see a TradingView chart showing the vault token price over time.
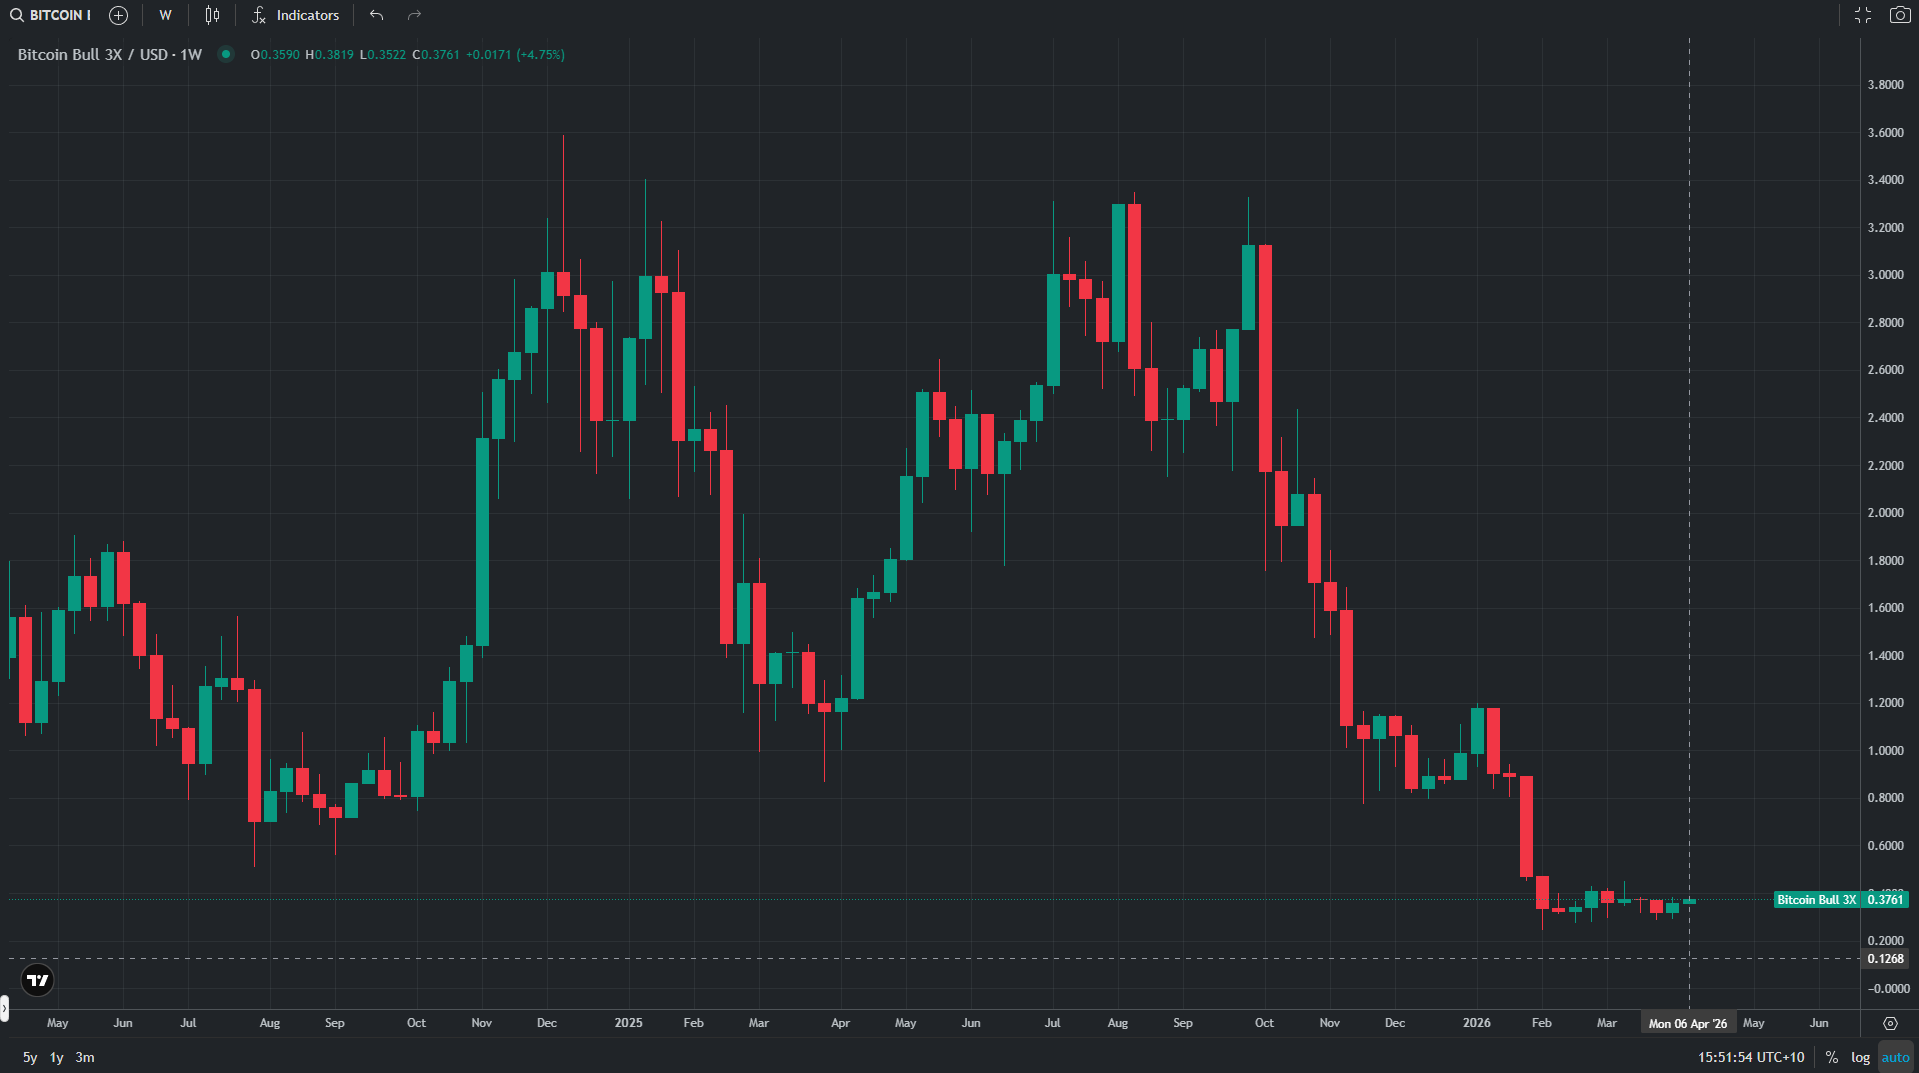
To get a better view, click the full screen icon in the top-right corner of the chart.
Explore the Chart
Once you're in the chart, you can:
- Change the timeframe using the options at the top (1D, 1W, etc.) to zoom in on recent performance or zoom out to see the bigger picture
- Hover over any candle to see the exact price at that point
- Scroll and zoom to move through the chart history
For managed vaults, the 1W and 1M timeframes give the clearest picture of how a strategy is performing over time.
That's It
TradingView charts are built into every vault page on dHEDGE. Open a vault, click the tab, and see exactly what's happening with your position.